LLM Observability in Production: Traces, Metrics & Root Cause
White Paper

Authors: Niamh Hughes & Samuel Adebayo, PhD
Revision: Kielty Hughes
Published: ISx4 • AI Research – 2026
Download PDFLarge language models (LLMs) are now being deployed as production components: assistants, support agents, analytics copilots, and tool-using workflows. Unlike traditional software, LLM-driven systems are probabilistic and context-dependent; the same input can yield different outputs, and failures are often emergent interactions between retrieval, tools, and policy layers.1 This makes the old idea of "monitoring the model" an incomplete strategy. In production, you need observability for the whole system. In this paper, we define LLM observability in production as the instrumentation, collection, and analysis of end-to-end telemetry (traces, logs, and metrics) that explains what the system did, why it did it, what it cost, and whether it behaved acceptably. Google SRE defines monitoring as collecting, processing, aggregating, and displaying real-time quantitative data about a system, alongside clear concepts for dashboards, alerts, and root cause.2 For LLM systems, that telemetry must include prompt and configuration versioning, retrieval provenance, tool-call details, safety and policy decisions, and user outcomes.
We argue for a measurement-first approach grounded in open standards. OpenTelemetry provides a common data model for traces, metrics and logs, and explicitly supports correlating these signals through trace context and resource attributes.3 OTLP provides a vendor-neutral protocol for exporting telemetry from applications to collectors and backends.4 OpenTelemetry's emerging semantic conventions for generative AI (GenAI) add a shared vocabulary for spans, events, and token-usage metrics, making it easier to compare behaviour across models and frameworks.5 6 7
Observability is also a governance control. Risk frameworks such as NIST's AI Risk Management Framework and its Generative AI Profile emphasise operational risk management and trustworthy AI practices.8 9 Security guidance such as the OWASP Top 10 for LLM Applications highlights concrete failure modes; prompt injection, sensitive information disclosure, excessive agency, and unbounded consumption; that are easier to detect and mitigate when an application is instrumented end-to-end.10
This whitepaper outlines the benefits and practical challenges of LLM observability, proposes a minimum viable telemetry schema, and illustrates a production scenario for a customer support agent. We close by comparing internal versus customer-facing deployments and summarising an implementation path for organisations that want reliable, auditable LLM systems at scale.
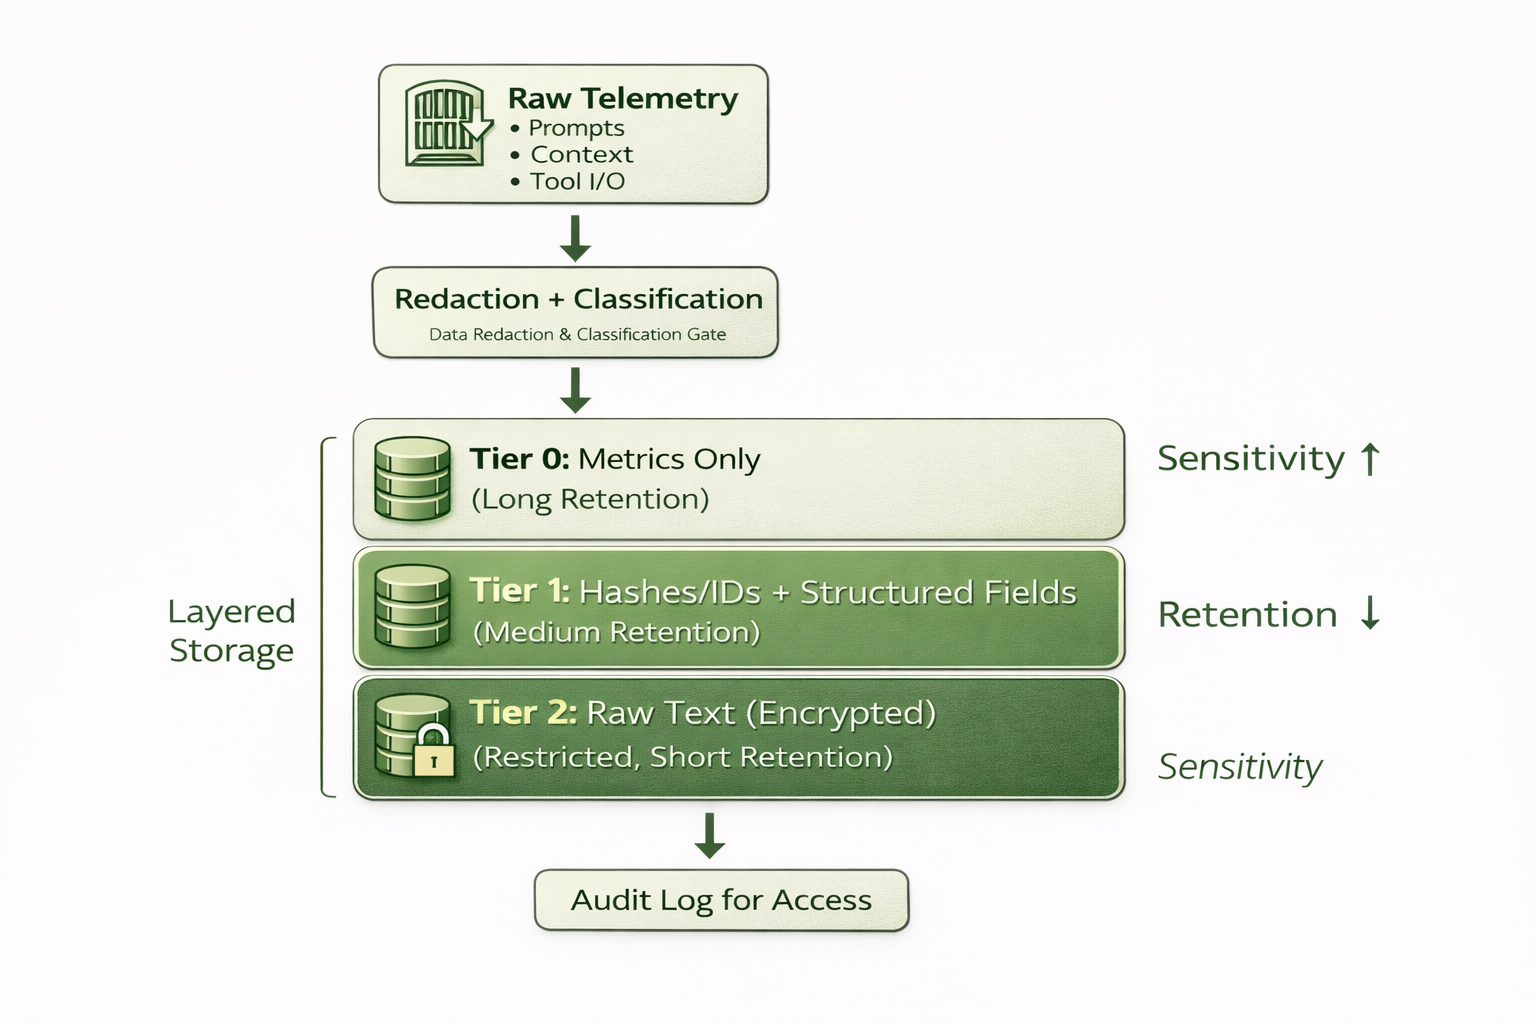
gen_ai.client.token.usage) when usage is available, which enables budget enforcement, anomaly detection and per-workflow unit economics.7 This is also a control against "unbounded consumption" and denial-of-service style failure modes highlighted in the OWASP LLM Top 10.10Privacy and PII exposure in telemetry: Prompts, retrieved context and tool outputs can contain personal data or sensitive business information. Data minimisation and storage limitation principles (UK GDPR Article 5) push teams to collect only what is necessary and retain it only as long as needed.14 Mitigations: redaction of PII before export; tiered retention (short for raw text, longer for hashes/metrics); separate stores for raw prompts with strict access controls; and clear "safe-to-log" rules for tool outputs.
Prompt and policy leakage: Full prompt capture is invaluable for debugging, but system prompts may embed proprietary policy or security controls. Mitigations: store prompt templates by ID and hash (see the telemetry schema in Section 6); treat system prompts as secrets; enforce role-based access; and log derived features (length, hash, template ID) by default, escalating to full-text capture only for sampled or incident-tagged traces.
Telemetry volume, high-cardinality attributes, and cost: LLM systems can generate many spans per request (especially multi-agent workflows), with attributes that explode cardinality (user IDs, document IDs, raw text). OpenTelemetry's metrics data model explicitly supports spatial and temporal reaggregation as cost controls.15 Mitigations: sampling (head or tail based); aggregation of high-cardinality attributes into low-cardinality tags; bucketing (e.g., token usage histograms as recommended for GenAI metrics); and "debug modes" that are time-bounded and incident-scoped.7
End-to-end correlation across a distributed stack: Production LLM systems are often polyglot and multi-service (API gateway, orchestrator, retrieval service, tool runners). Correlation fails when trace context is not propagated consistently. Mitigations: adopt W3C Trace Context headers (traceparent/tracestate) for HTTP/gRPC boundaries; enforce propagation in SDKs and middleware; and include TraceId/SpanId in structured logs for cross-signal navigation.3 16
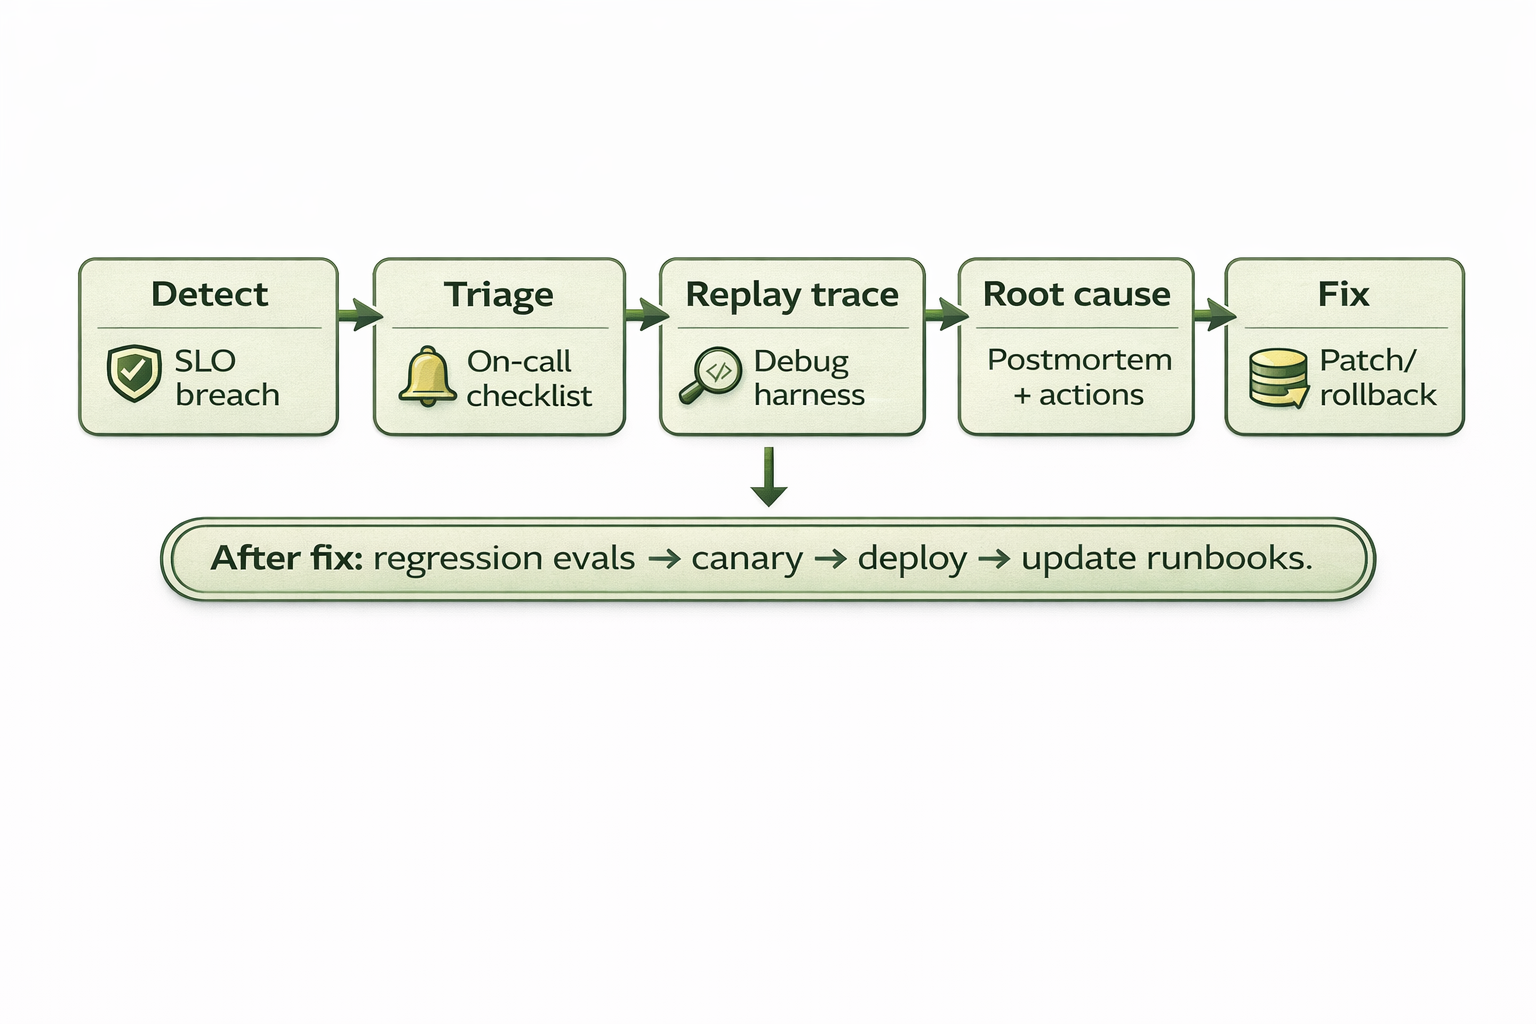
Non-determinism and "heisenbugs": LLM outputs can vary even when inputs look identical, and production failures may be unreproducible without capturing the full execution context. LangSmith (and similar tools) highlight non-determinism as a core reason observability is harder for LLM apps than for traditional software.1 Mitigations: version everything (model, prompt template, retrieval index, tool versions); log random seeds where applicable; capture retrieved chunk hashes; and maintain replay harnesses that can re-run a trace with the same inputs (or as close as possible) for debugging and evaluation.
Evaluation drift and silent regressions: A system can remain "up" but degrade in correctness, safety or tone after a model update, knowledge-base change, or prompt edit. Mitigations: treat evaluations as production controls (continuous regression evals, canaries, and A/B tests); maintain labelled datasets for critical intents; and integrate eval results into dashboards and release gates. OpenAI Evals provides a concrete mechanism to codify and run such evaluations.12
Security failure modes are workflow failures: Prompt injection, insecure output handling, and excessive agency are not just "model problems" – they are pipeline design problems. OWASP's LLM Top 10 provides a practical taxonomy of these issues.10 Mitigations: instrument policy decisions and tool permission checks as first-class spans/events; require human approval for high-impact actions; and log "reason codes" for blocked or transformed outputs to support audits.
Organisational adoption and alert fatigue: Observability programmes fail when they become "data exhaust" with no operational owner. SRE guidance stresses that paging humans is expensive and that alerting systems should have high signal and low noise.2 Mitigations: define clear ownership, SLOs, and runbooks; start with a small set of high-value signals (quality, cost, latency, safety); and operationalise a blameless postmortem loop for incidents and near-misses.17
A production-grade LLM observability stack is not a single tool. It is a design choice that spans your application architecture, telemetry standards, and operational processes. At a minimum, you should be able to answer four questions for any production interaction:
(1) what happened
(2) why did it happen
(3) what did it cost
(4) was it acceptable
The foundation is the same as in conventional observability: logs (human-readable events), metrics (aggregated time-series), and traces (causal request paths). OpenTelemetry explicitly targets unified collection of these signals and correlation via shared trace context and resource attributes.3 For LLM systems, traces provide the backbone, because they let you represent a single user request as a structured execution graph and attach key LLM-specific metadata as attributes or events (see Figure 2).
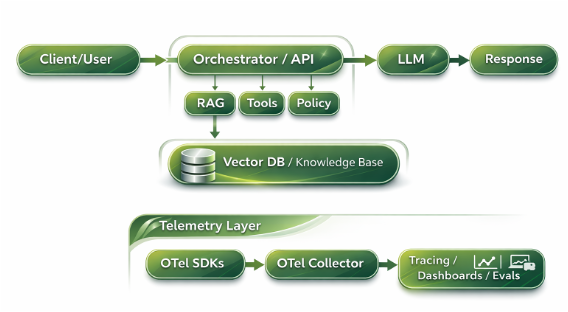
Figure 1 presents a vendor-neutral reference architecture. An orchestrator receives a request, retrieves context (RAG), calls tools/APIs as needed, applies policy checks and produces a response. Observability is treated as an independent pipeline: application code emits telemetry through OpenTelemetry SDKs, exports it via OTLP to a collector, and then routes it into one or more backends for tracing, dashboards, incident response, and evaluation.4 18
Trace context propagation is the non-negotiable prerequisite for end-to-end debugging. The W3C Trace Context specification defines standard headers (traceparent/tracestate) that allow trace correlation across services and vendors.16 In practice, this means instrumenting every network boundary (API gateway, orchestrator, retrieval service, tool runner) to accept and forward trace context, and ensuring that logs include TraceId/SpanId where possible for cross-navigation.3
Semantic conventions are what make telemetry portable. OpenTelemetry's general and trace semantic conventions provide guidance for consistent attribute naming across spans and signals.19 20 For generative AI, OpenTelemetry's GenAI semantic conventions propose standard attributes for spans and events (e.g., provider, model, conversation identifiers) and standard token-usage metrics.5 6 7 Even if you do not adopt them wholesale, they are a useful baseline for building a schema that is stable over time.
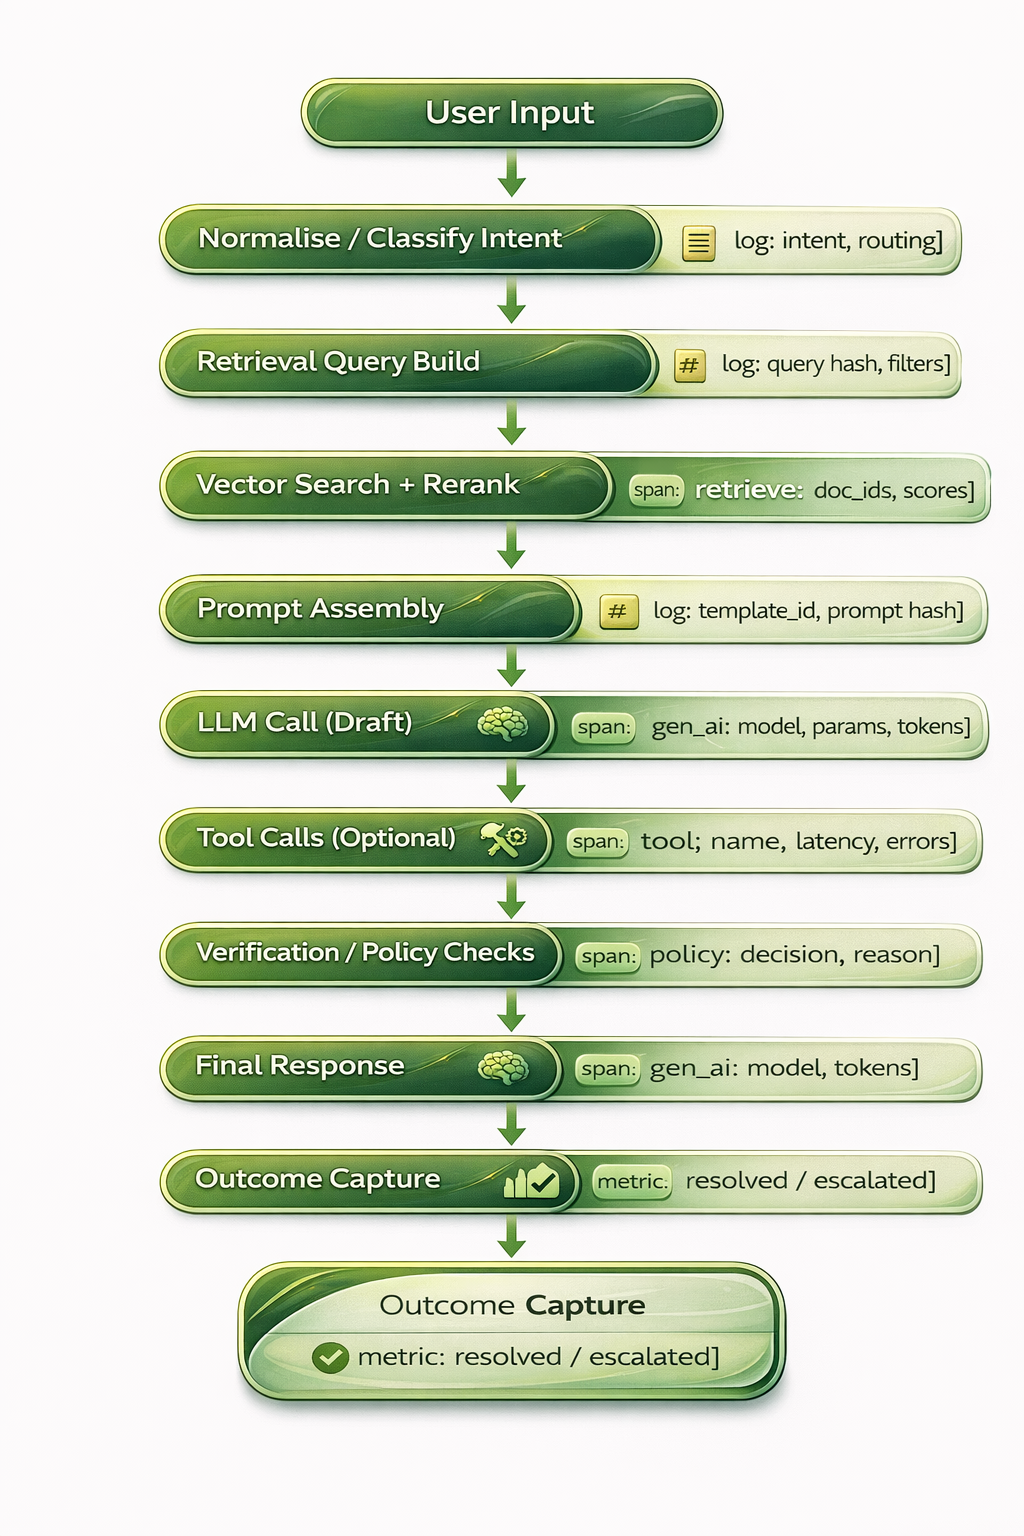
Figure 3 highlights where to instrument a typical RAG + tools pipeline. The most common production failures are not located "inside the model" but in the boundary conditions: retrieval returning stale or irrelevant context, a tool call timing out, a policy guard blocking content, or a prompt template change that shifts behaviour. Instrumenting each stage provides a causal narrative, rather than a single opaque completion.
Retrieval telemetry deserves special attention. Retrieval-augmented generation was introduced to provide LLMs with an explicit non-parametric memory and provenance over retrieved passages.21 In production, you should log what was retrieved (document IDs, chunk hashes, similarity scores), not only what was generated. This is the difference between "the model hallucinated" and "the retriever fed it the wrong evidence."
Finally, LLM observability is incomplete without evaluation. Traces give you the raw artefacts; evaluations give you a controlled measurement of quality, safety and drift. In practice, this means tying production traces to an evaluation harness (offline replay, regression suites, canary analyses) and tracking evaluation results as first-class metrics in the same dashboards as latency and cost.12
| Field | Type | Example | Notes / Rationale |
|---|---|---|---|
trace_id | string | 4bf92f3577b34da6a3ce929d0e0e4736 | End-to-end correlation across services (W3C trace context).16 |
span_id / parent_span_id | string | 00f067aa0ba902b7 | Reconstruct causal structure and timing (spans).19 |
timestamp, duration_ms | datetime/int | 2026-02-23T10:15:32Z, 842 | Latency breakdown and SLO monitoring.11 |
service.name, deployment.environment | string | support-orchestrator, prod | Resource attributes for correlation across logs/metrics/traces.3 |
gen_ai.provider.name | string | openai / aws.bedrock / self-hosted | Low-cardinality provider tag for sampling and reporting.5 |
gen_ai.request.model / response.model | string | gpt-4.1-mini | Versioning; supports regression analysis.5 |
prompt.template_id | string | SUPPORT_V3 | Log template identifier, not raw text (default). |
prompt.hash | string | sha256:... | Detect prompt changes and support replay without leaking content. |
prompt.store_ref (optional) | string | s3://.../prompt/... | Pointer to encrypted store for authorised incident review only. |
retrieval.query.hash | string | sha256:... | Correlate retrieval behaviour without storing raw query. |
retrieved.doc_ids | array[string] | [KB-421, KB-992] | Provenance for answers; supports freshness checks.21 |
retrieved.scores | array[float] | [0.82, 0.77] | Diagnose retrieval quality and reranker changes. |
retrieved.chunk_hashes | array[string] | [sha256:...] | Replay and provenance even if documents change. |
tool.name | string | crm.lookup_account | Tool usage analytics and debugging. |
tool.input_redacted | json | {account_id:'***'} | PII-safe logging; redaction before export.14 |
tool.output_redacted | json | {status:'active'} | Avoid leaking sensitive data; keep low risk fields. |
policy.decision | string | allow / block / require_approval | Audit trail for governance and security.10 |
policy.reason_code | string | PII_DETECTED / HIGH_IMPACT | Explainable control decisions. |
gen_ai.client.token.usage | histogram | input=812, output=214 | Cost and budget monitoring; follow GenAI metrics guidance.7 |
user_feedback.label | string | helpful / not_helpful | Online learning signal; tie to business outcomes. |
resolution.outcome | string | resolved / escalated / abandoned | End-to-end success measurement.2 |
error.type / exception | string | timeout / rate_limit | Reliability tracking; unify error taxonomy.5 |
To make observability concrete, we consider a customer support agent that answers product questions, checks account status in a CRM, and drafts responses that meet policy requirements. This is a common production pattern: a high-volume workflow where correctness and tone matter, and where the agent may take actions beyond text generation (e.g., updating a ticket).
End-to-end workflow (step-by-step):
1. User query received: the system assigns a trace_id, classifies intent, and records basic request metadata.
2. Retrieval: the agent queries the knowledge base, applies filters (product, locale, freshness), and returns top-k passages.
3. Tool call: if the answer depends on account context, the agent calls CRM.lookup_account.
4. Draft response: the model generates a draft with citations to retrieved passages.
5. Verification and policy: a verifier checks for policy compliance, PII leakage, and whether the answer is grounded in retrieved content.
6. Final response and outcome: the system returns the response, updates the ticket, and records whether the issue was resolved or escalated.
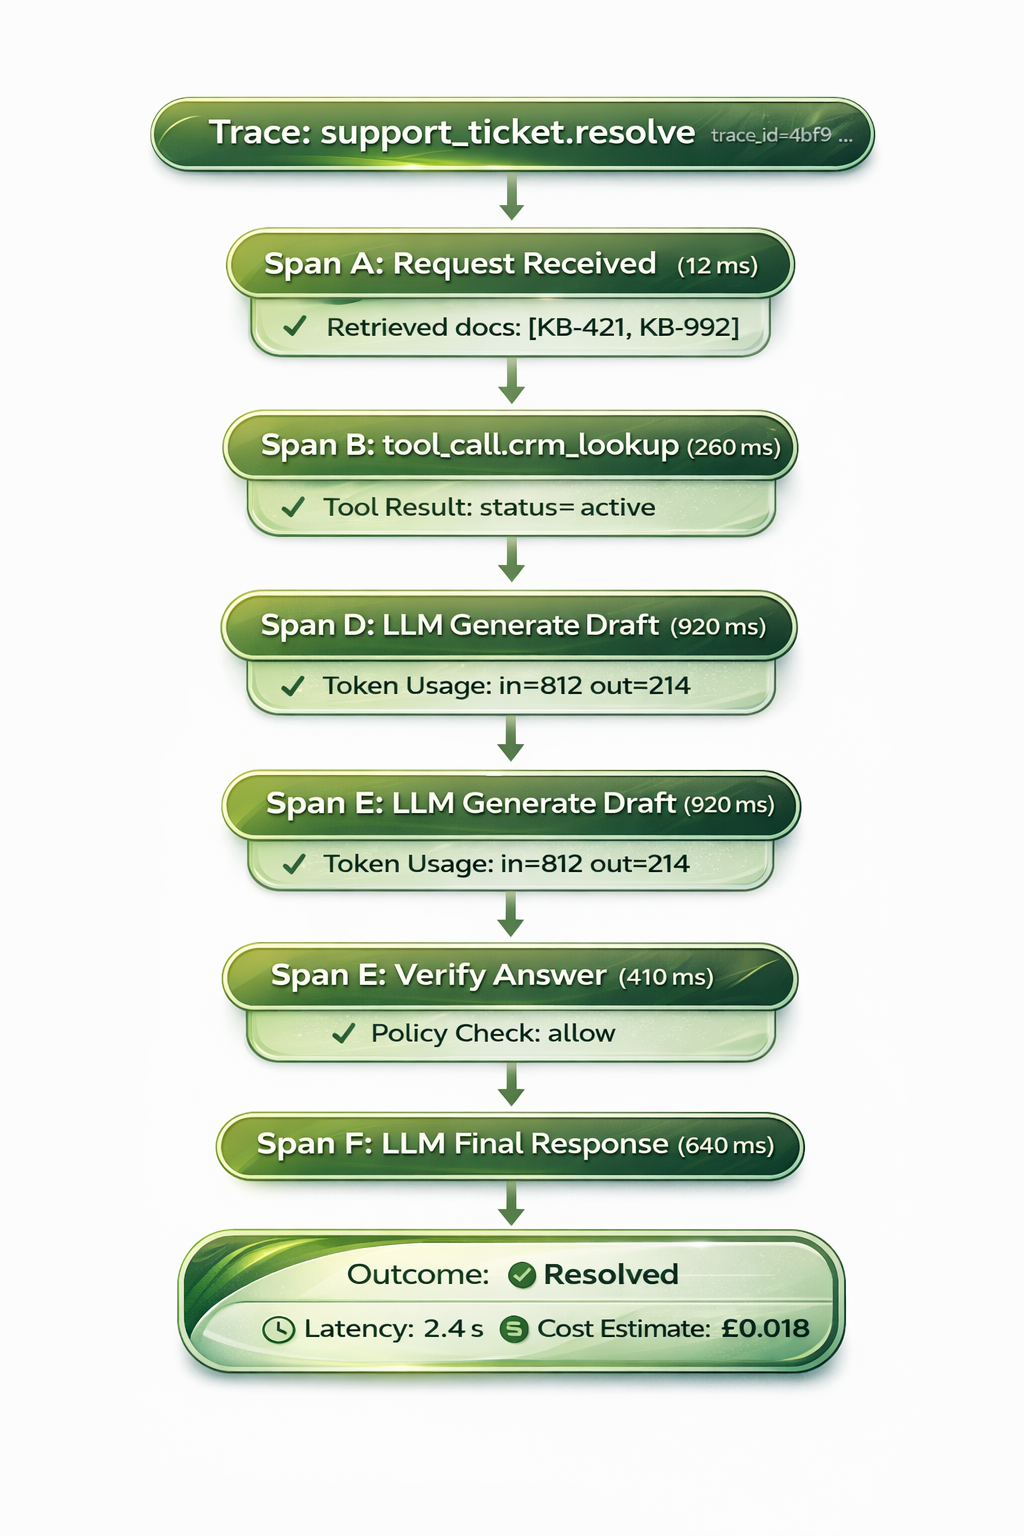
At each step, the system emits telemetry. Figure 2 shows what a single request looks like as a trace. The key is that each major operation becomes a span with timing, errors, and domain-specific attributes (retrieved doc IDs, tool name, model version, token usage). When an agent misbehaves, the trace is the "black box flight recorder" that lets you replay and diagnose the failure.
What gets logged – a practical view:
- Retrieval span: query hash; filters; doc IDs + similarity scores; chunk hashes; retrieval latency.
- Tool span: tool name; latency; error.type; input/output redacted; permission decision.
- Model span: model name/version; parameters (temperature); token usage; output type.
- Policy span: decision (allow/block/require_approval); reason codes; transformations applied.
- Outcome metrics: resolved/escalated; human rating; customer satisfaction label (if available).
Mini incident postmortem (example):
Incident: customers received an incorrect refund window for a specific subscription tier.
Impact: increased complaints and escalations; support team workload spiked.
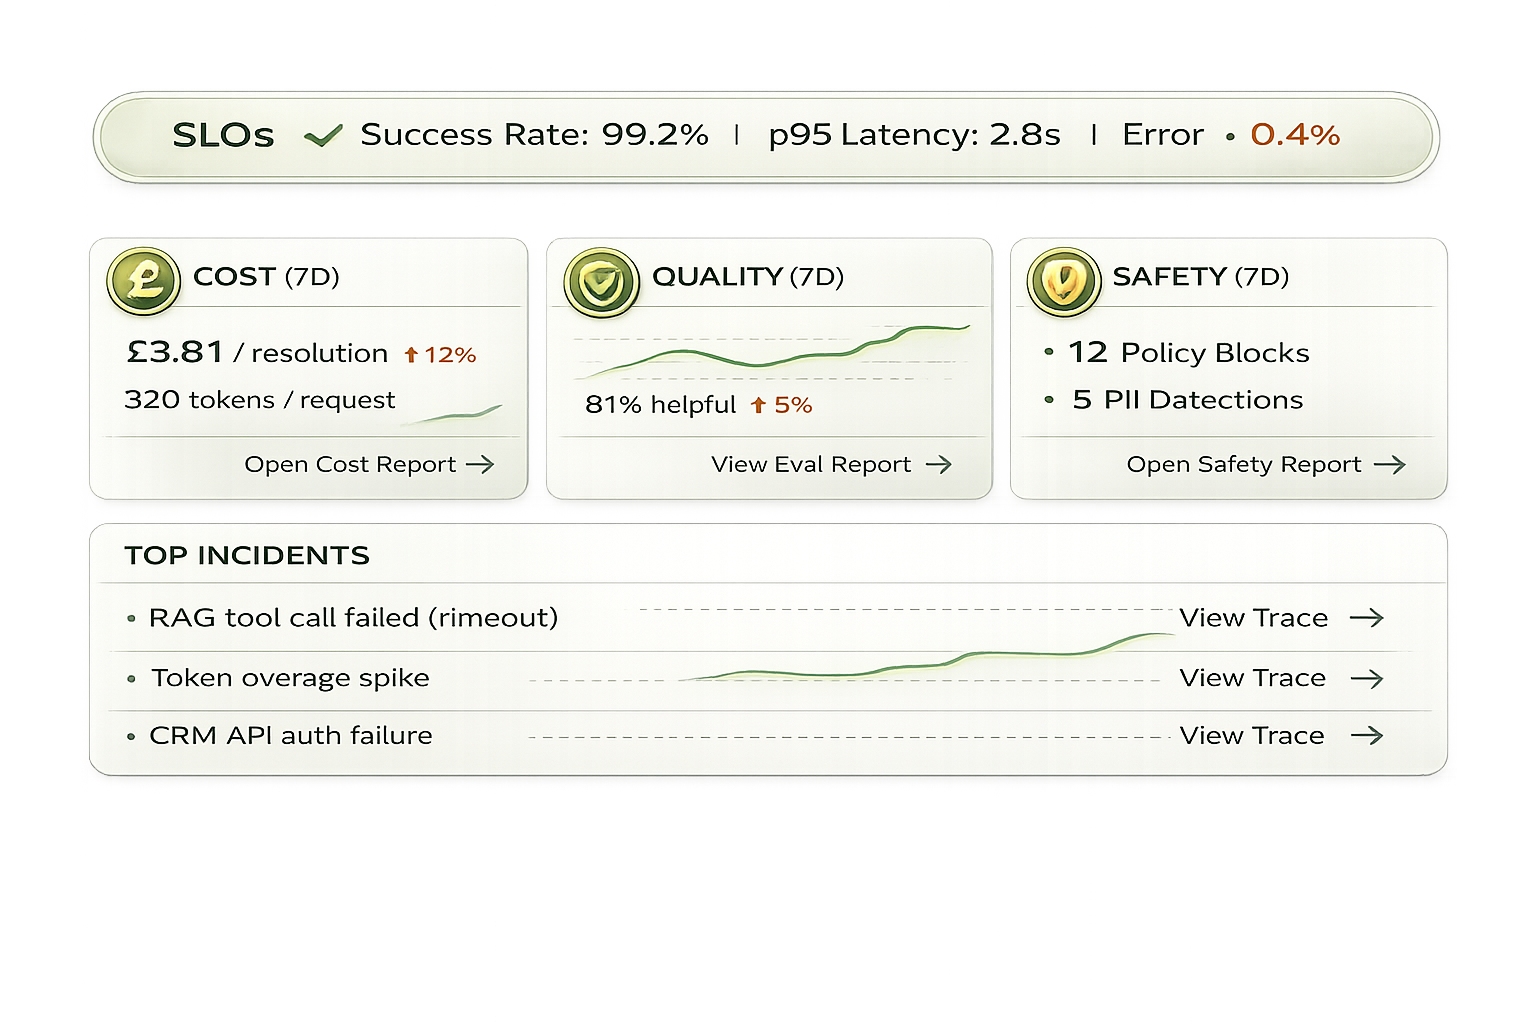
Detection: the "refund policy correctness" eval score dropped below threshold and customer "not helpful" feedback rose (see Figure 7).11
Trace evidence: traces showed retrieval consistently returning an outdated policy article (KB-421) because the freshness filter was misconfigured; the model faithfully used the retrieved text.
Root cause: deployment of a new retrieval index without a required metadata field, causing the filter to silently fail.
Fix: enforce schema validation for indexed documents; add a retrieval regression eval (Precision@k); and add an alert on missing freshness metadata.
Prevention: adopt a blameless postmortem process with explicit follow-up actions and owners.3
Figure 7 illustrates a dashboard layout that makes these trade-offs visible. A useful dashboard does not merely report tokens or latency; it ties telemetry to outcomes: cost per resolution, eval score trends, policy blocks, and incident links. This is what turns observability into an operational control rather than an engineering afterthought.
Observability requirements change depending on who the system serves. Internal copilots are typically used by employees with existing access to data and processes. Customer-facing systems operate in a higher-risk environment: stronger privacy constraints, higher brand impact, and a lower tolerance for ambiguous outputs.
In both cases, the engineering telemetry is similar – traces, logs and metrics – but the governance envelope differs. Customer-facing deployments generally require stricter retention limits for raw content, tighter access controls, more conservative tool permissions, and formal release gates driven by evaluations and SLOs.11 14
Table 2 provides a practical policy matrix. The intent is not to slow teams down, but to make risk explicit and manageable. A common failure mode is to prototype with permissive logging and broad tool access and then attempt to retrofit controls after a security or privacy incident. Figure 6 shows a governance pattern that can be adopted early: classify/redact data before export, and split storage into tiers with different retention and access constraints.
| Policy Area | Internal (employee-facing) | Customer-facing (external) |
|---|---|---|
| Telemetry sampling | Moderate sampling; debug mode permitted for short windows | Conservative sampling with strict controls; debug mode only for incident IDs |
| Prompt/content retention | Short retention for raw text; longer for hashes/metrics | Minimise raw text retention; prefer hashes + structured summaries (GDPR principles).14 |
| PII handling | Redact; allow restricted access for support/engineering | Redact by default; stronger access controls and audit logging; DPIA where required |
| Tool permissions | Broader tool access; still least-privilege | Strict least-privilege; approval gates for high-impact actions (payments, account changes) |
| Release gating | Recommended for critical workflows | Required: canary + regression evals + rollback plan (SLO-driven).11 |
| Incident response SLA | Business-hours for most issues | Defined SLA; on-call rotation; postmortems for significant incidents.17 |
| User transparency | Internal policy notice | Clear customer notices where appropriate; complaint/audit support |
LLM systems fail differently to conventional software. They are non-deterministic, sensitive to context, and often embedded in multi-step workflows that include retrieval, tools and policy gates. As a result, "monitoring the model" is not enough. Production reliability requires observability of the whole pipeline: traces that explain execution, metrics that track cost and outcomes, and logs that support human debugging.
A practical implementation path is straightforward:
1) Start with end-to-end tracing for one high-value workflow, with W3C trace context propagation and a minimal schema (Section 6).
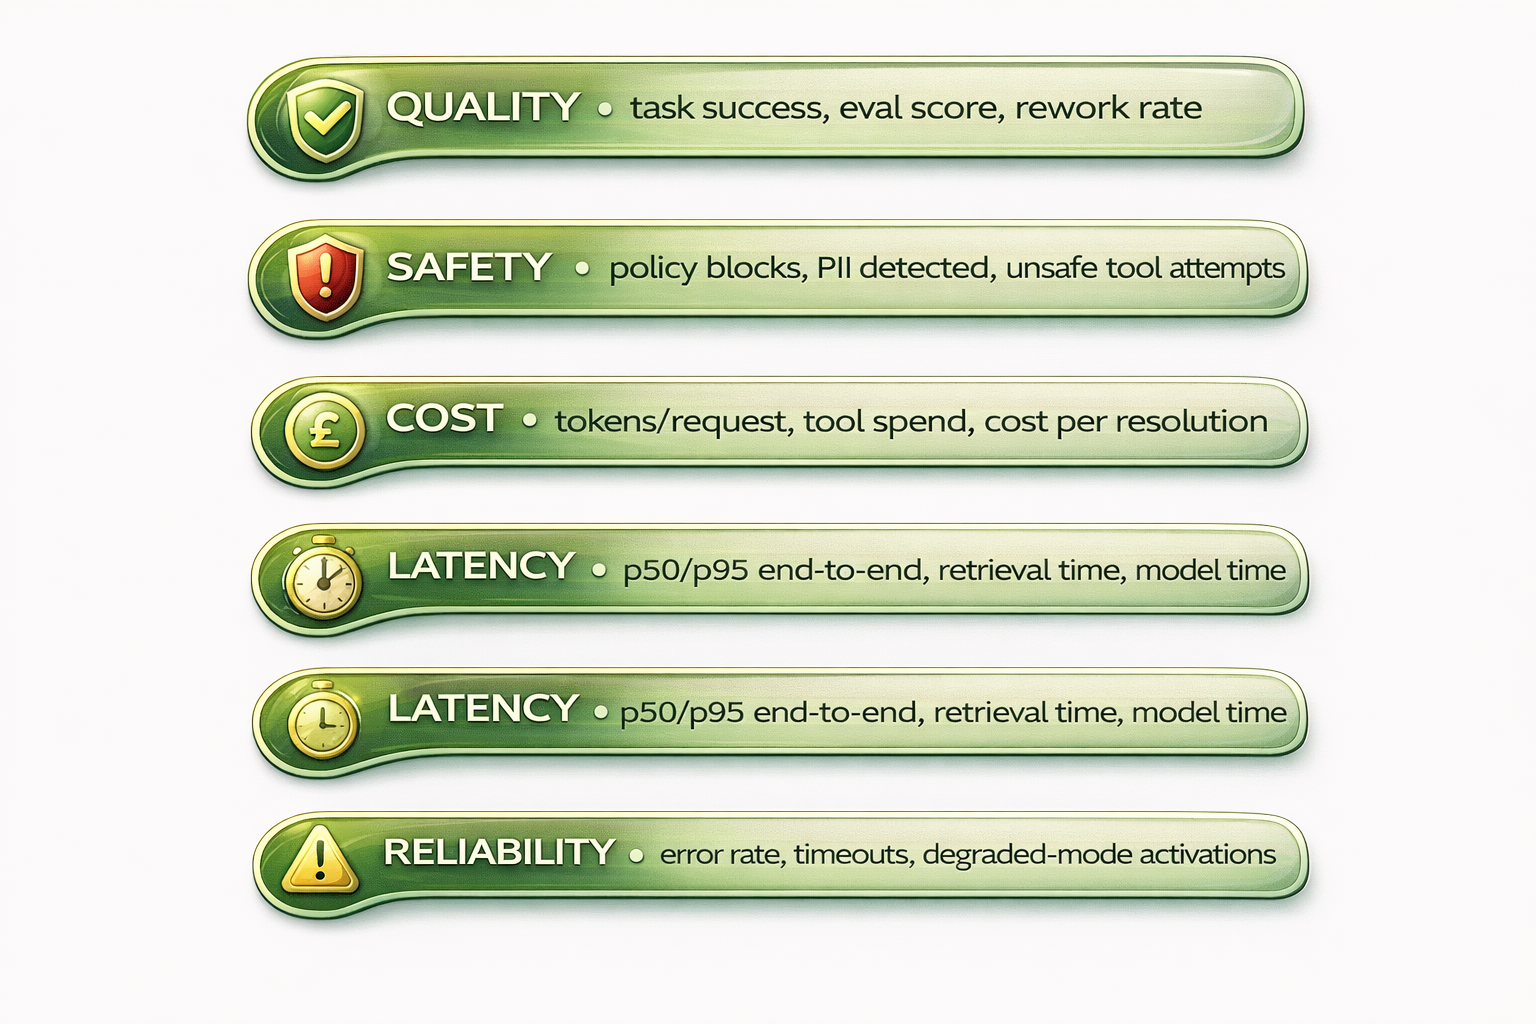
2) Add cost and quality metrics (Figure 4) and define 2-3 SLOs tied to user outcomes (e.g., resolution rate, policy compliance rate).2
3) Integrate an evaluation harness and add regression gates for prompt, model, and retrieval changes.12
4) Operationalise incident response using trace replay and blameless postmortems (Figure 5).17
ISx4 builds measurement-first LLM systems with auditability, governance and infrastructure control. We help teams design the telemetry schema, instrument their pipelines, stand up an observability stack using open standards (OpenTelemetry/OTLP), and connect evaluation results to operational dashboards. If you want to deploy LLM systems that are reliable, explainable, and manageable at scale, we invite you to engage ISx4 for a strategy discussion or pilot.